Research
My research statement is in preperation at the moment.
My PhD research work was concerned with the development of machine learning and deep learning methods for detecting atmospheric phenomena (patterns) in large climate datasets. In particular, I have carried out research on atmospheric rivers and atmospheric blocks that usually lead to extreme weather events in mid-latitude regions. I have also participated in the Atmospheric River Tracking Method Intercomparison Project (ARTMIP) where I have developed a pattern recognition method that combines topological data analysis and machine learning (TDA-ML) for identifying atmospheric rivers in global climate model outputs. My thesis is available on the university archive.
My research involves the deveploment and application of machine learning, deep learning, and causal inference methods on vast and various climate datasets, including the output from climate models and reanalysis products.

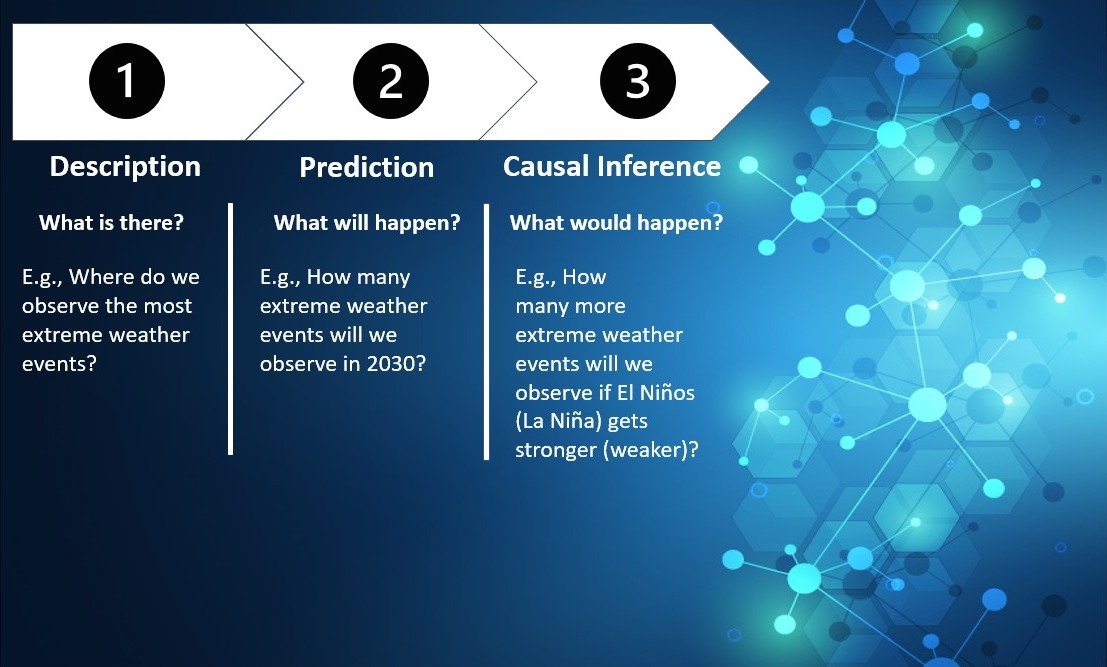
I aim at recognising and understanding the climate and weather variability, the changes in frequency and strength of extreme weather events, and to support decision makers and future climate predictions.
Applications to Climate Science:
Detecting Drivers of Heavy Precipitation in the Himalayan Region
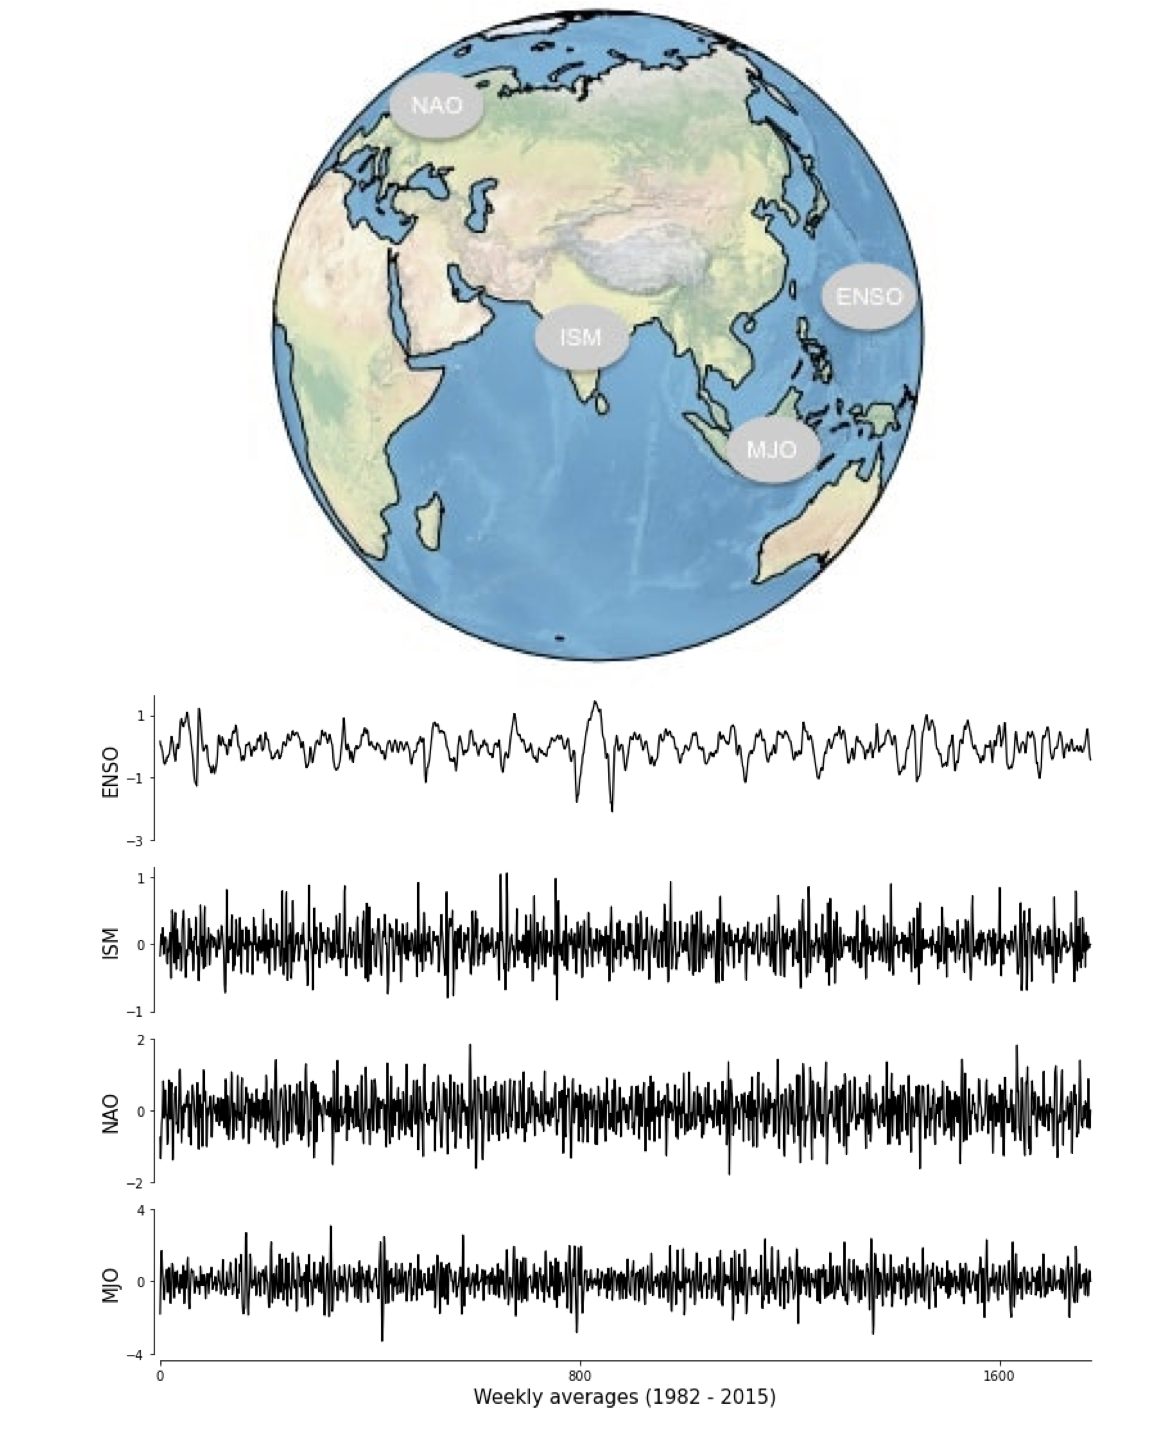
We aim at investigating tropical and midlatitude teleconnections (i.e., ENSO, MJO, and NAO) interacting with the ISM precipitation.

The above picture shows approximate geographic location of ISM, ENSO, MJO, and NAO. The bottom one displays climate indices of ISM, ENSO, MJO, and NAO at weekly scale (19822015).
Detecting Atmospheric River Phenomena in Climate Data
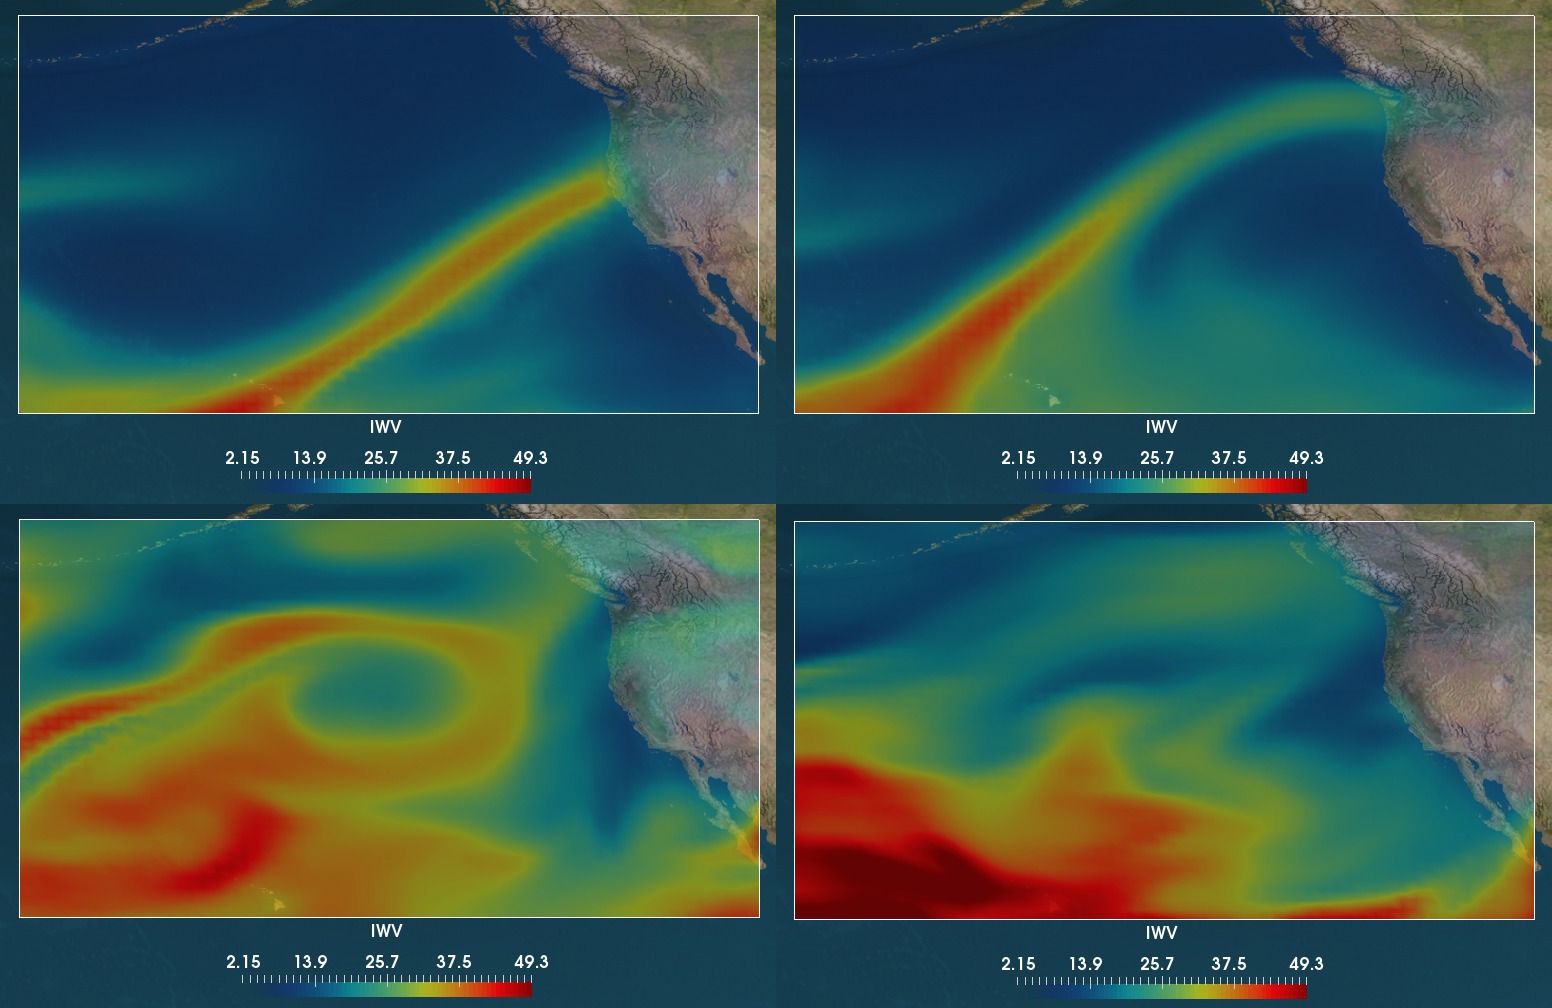
As part of my research work, I have been studying atmospheric river phenomena that often lead to extreme weather events, such as floods, landslides.

The picture above shows the Integrated Water Vapour (IWV) formally the mass of water vapour in the vertical column over a square meter (kg/m^-2). Higher values of IWV correspond to the red colour, lower values are shown by the blue colour. The top row shows examples of Atmospheric Rivers (ARs) and the bottom row displays instances of non-Atmopsheric Rivers (non-ARs).
Detecting and Localising Atmospheric Blocking Phenomena in Climate Data
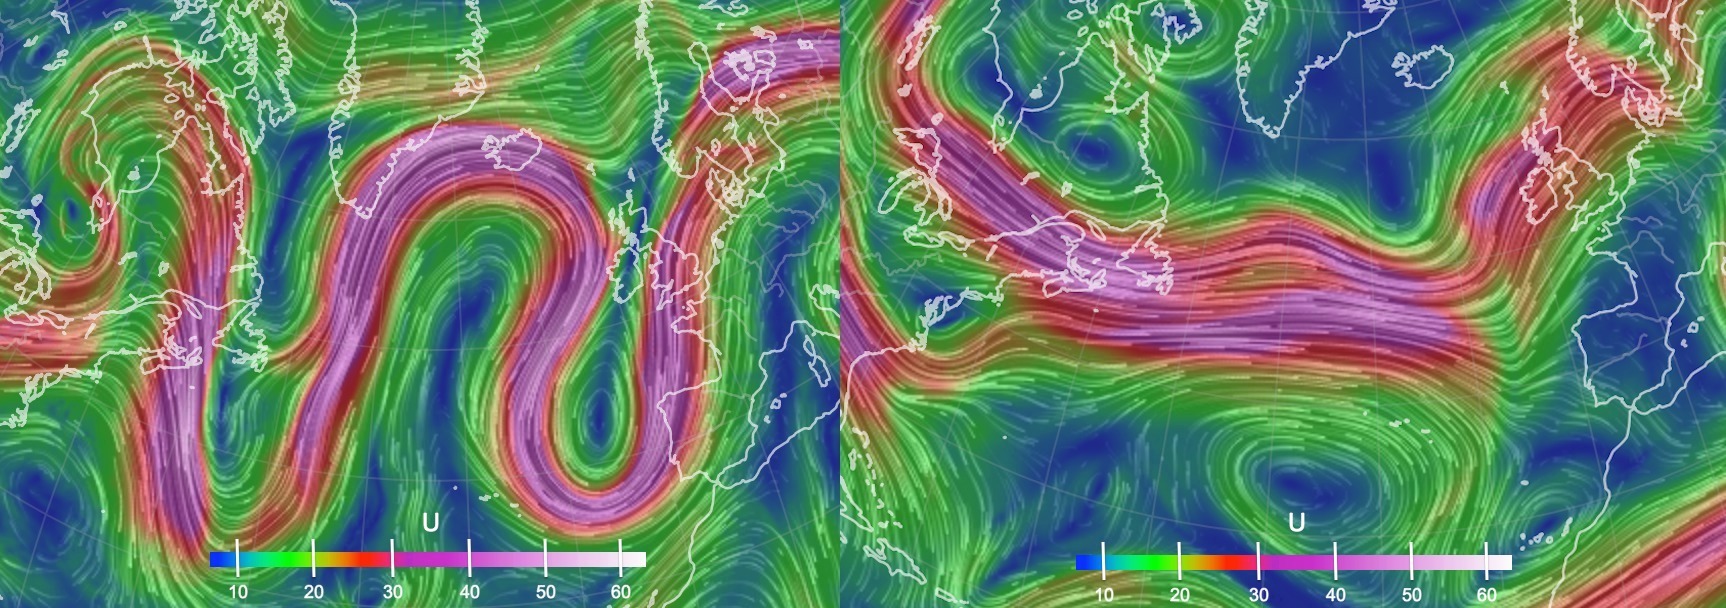
I also have been working on atmospheric blocking identifitcation that usually lead to extreme weather, such as heat or cold waves, droughts.

The picture above shows the wind speed field in m/s at 250hPa pressure level. The left panel displays an example of Atmospheric Blocking (AB) that has a shape of the Greek letter omega. The right panel shows an example of non-Atmospheric Blocking (non-AB) that does not cause unusual changes in the normal flow of zonal winds.
